The intrinsic properties of working systems are the subject of study of many fields. Grey Systems Theory was established by Julong Deng in 1982 in China, since then, Grey methods were applied to many practical problems such as agriculture, ecology, economy, meteorology, medicine, history, geography, industry, earthquake, geology, sport, traffic, management, and more. The goal of Grey System theory is to provide theory, techniques, and ideas to analyze latent and intricate systems. It studies problems that are difficult for probability and fuzzy mathematics to handle, usually with partially known, inaccurate, or incomplete information.
“When the available information is incomplete and the collected data inaccurate, any pursuit of chasing precise models, in general, becomes meaningless.”
For some types of systems, more complexity means less representation ability, which means less precision. Grey Systems aims to uncover the laws of evolution of the systems’ behavioral characteristics by:
- Excavating and organizing the available raw data (sometimes finding new data)
- Assuming that even if the expression of an objective system is complicated, its data chaotic, the system still possesses overall functions and properties that can be extracted.
For a further study on Grey System the general topics are:
- Grey Relational Space
- Grey Generating Space
- Grey Forecasting
- Grey Decision Making
- Grey Control
- Grey Mathematics
- Grey Theory
An initial analysis: Grey Relational Coefficient
The Grey Relational Coefficient can also be called the Degree of Grey Incidence and it’s used when one needs to determine the factors that influence the behavior of the system. By using concepts of the grey relational space one can describe the relationship between one main factor and all the other factors in a given system. This analysis holds a few similarities with the calculation of the correlation coefficient.
Test Dataset
Before going into the specifics of the Grey Relational Coefficient, here’s an example using the correlation coefficient. For the rest of the article I will be using:
- Python libraries: sckit-learn, pandas, NumPy, seaborn, and matplotlib
- Public gait dataset of patients with Neurodegenerative Disease Database.
- Full code here: https://github.com/rsarai/grey-relational-analysis
Correlation Analysis
Correlation refers to the degree to which a pair of variables are linearly related – Wikipedia
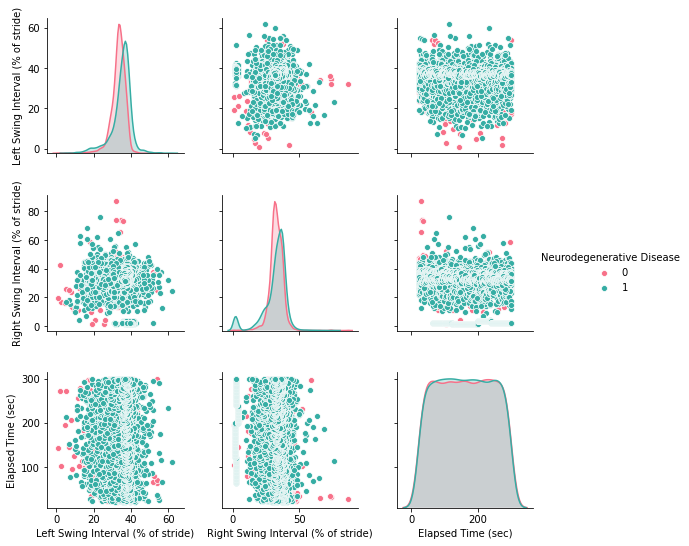
# ... load small set of the dataset in "df"
import seaborn as sns
sns.pairplot(df, hue="Neurodegenerative Disease", palette="husl")
Computing the correlation out of this dateset:
import seaborn as sns
sns.heatmap(df.corr(), annot=True)
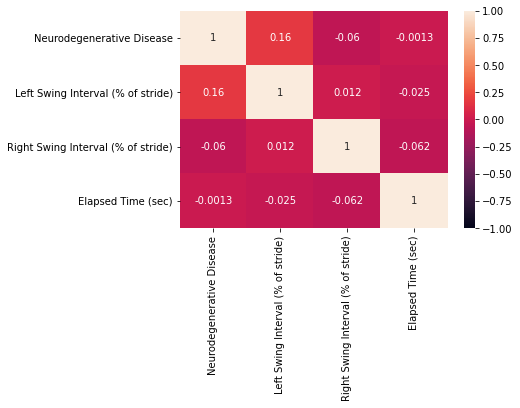
The correlation heatmap shows as expected that:
- The diagonal is 1, which corresponds to the correlation of a number with itself
- The matrix is symmetric
- The features are not correlated since the values are all close to zero.
Using the Grey Relational Coefficient
The formal mathematical definition bellow states that:
- A Grey Relational Space denoted by (Χ, τ)
- X is an array of arrays with sequences to be compared with a reference
- τ is a map called grey relational map
- γ is the grey relational coefficient (it belongs to τ, as an appointed relational map)
- ζ is the distinguishing coefficient (value between O, 1)
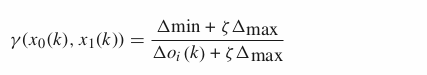
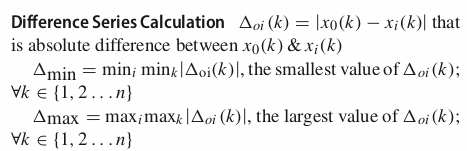
The intuition is that the algorithm get the relationship between a sequence x0 and a sequence xi, the grey relational coefficient (γ). All the coefficients of the equation depend on the absolute difference between the two sequences.
This translates into code as:
import numpy as np

# source: https://programmer.group/5e4b66268a670.html
# full code here: https://github.com/rsarai/grey-relational-analysis

class GreyRelationalCoefficient():

    def __init__(self, data, tetha=0.5, standard=True):
        '''
        data: Input matrix, vertical axis is attribute name, first column is parent sequence
        theta: Resolution coefficient, range 0~1,Generally take 0.5,The smaller the correlation coefficient is, the greater the difference is, and the stronger the discrimination ability is
        standard: Need standardization
        '''
        self.data = np.array(data)
        self.tetha = tetha
        self.standard = standard

    def get_calculate_relational_coefficient(self, parent_column=0):
        self.normalize()
        return self._calculate_relational_coefficient(parent_column)

    def _calculate_relational_coefficient(self, parent_column):
        momCol = self.data[:,parent_column].copy()
        sonCol = self.data[:,0:]

        for col in range(sonCol.shape[1]):
            sonCol[:,col] = abs(sonCol[:,col]-momCol)

        minMin = np.nanmin(sonCol)
        maxMax = np.nanmax(sonCol)

        cors = (minMin + (self.tetha * maxMax)) / (sonCol + (self.tetha * maxMax))
        return cors
Running and checking results:
# source: https://programmer.group/5e4b66268a670.html
# full code here: https://github.com/rsarai/grey-relational-analysis

K = len(df.columns)
correl = []
for i in range(K):
    model = GreyRelationalCoefficient(df, standard=True)
    cors = model.get_calculate_relational_coefficient(parent_column=i)
    mean_cors = cors.mean(axis=0)
    correl.append(mean_cors)

sns.heatmap(correl, annot=True, xticklabels=df.columns, yticklabels=df.columns)
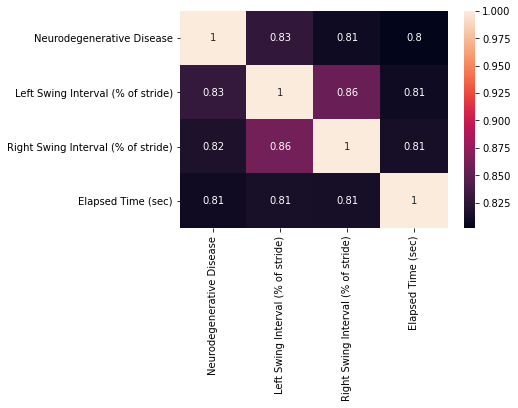
The results show a different perspective of the Correlation Coefficient in the first section. Again as expected, the diagonal is 1, however, this time the matrix is not exactly symmetric. As major changes, our lower bound is 0.81 showing that the algorithm considers all the features to be similar, especially the features Left Swing Interval and Right Swing Interval that scored 0.86 of similarity. The results reflect the nature of gait, both features can be considered similar because they act as a delayed mirror of the other.
This shows that the grey relational coefficient is a more precise measure of similarity than correlation coefficients for gait data.
- OBS: The grey relational coefficient follows four axioms, they are Norm Interval, Duality Symmetric, Wholeness, and Approachability.